
Estimated reading time: 1 minute
Our 2024 renting statistics offer a comprehensive look into the renter income, demographics, behaviors, and preferences of renters, providing valuable insights for rental companies, stakeholders, renters and press.
Here’s an in-depth analysis of the key findings from the data, along with actionable takeaways to enhance customer engagement and satisfaction.
Approach
The analysis is based on data extracted from June Homes’ systems, encompassing thousands of renters across 10 major US cities. The methodology involved:
- Data Collection: Aggregating 2024 data from our internal systems to capture a holistic view of renter demographics and behaviors.
- Data Cleaning: Ensuring the data was accurate and consistent by handling missing values and correcting any inconsistencies.
- Data Analysis: Employing statistical methods and visualization techniques to uncover patterns and insights across different renter attributes.
- Insight Extraction: Identifying key trends and correlations within the data to draw actionable insights.
TL;DR: 2024 Renters’ Statistics – Main Insights and Takeaways
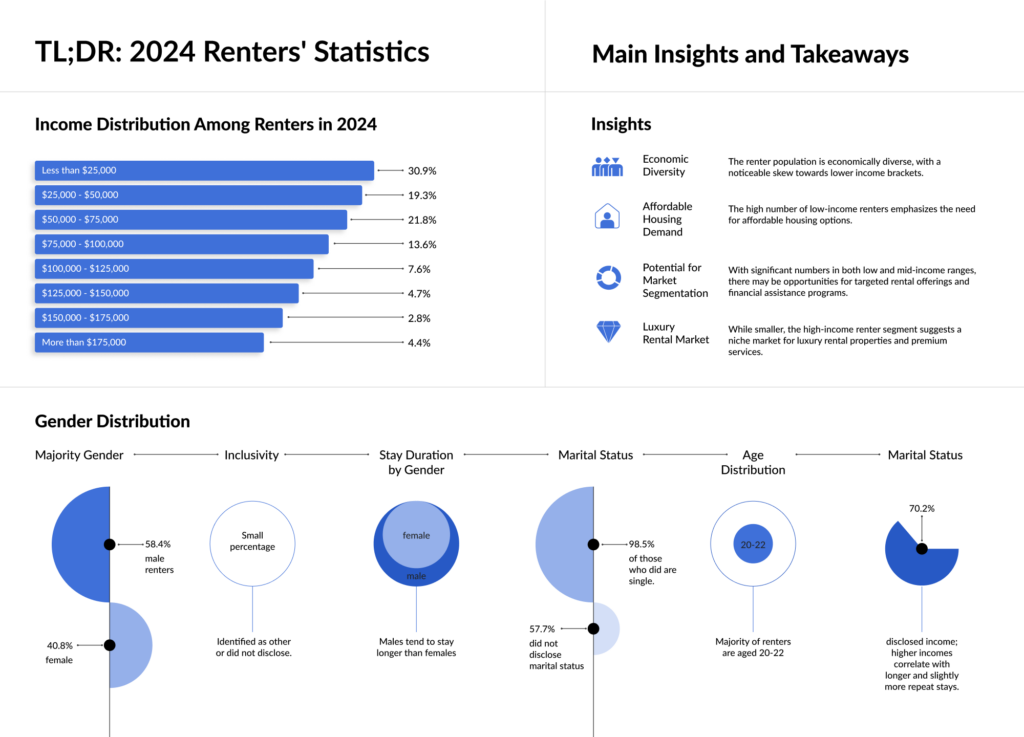
Income Distribution Among Renters in 2024:
- Less than $25,000: 30.9%
- $25,000 – $50,000: 19.3%
- $50,000 – $75,000: 21.8%
- $75,000 – $100,000: 13.6%
- $100,000 – $125,000: 7.6%
- $125,000 – $150,000: 4.7%
- $150,000 – $175,000: 2.8%
- More than $175,000: 4.4%
Insights:
- Economic Diversity: The renter population is economically diverse, with a noticeable skew towards lower income brackets.
- Affordable Housing Demand: The high number of low-income renters emphasizes the need for affordable housing options.
- Potential for Market Segmentation: With significant numbers in both low and mid-income ranges, there may be opportunities for targeted rental offerings and financial assistance programs.
- Luxury Rental Market: While smaller, the high-income renter segment suggests a niche market for luxury rental properties and premium services.
Gender Distribution:
- Majority Gender: 58.4% male renters, 40.8% female.
- Inclusivity: Small percentage identified as other or did not disclose.
Stay Duration by Gender:
- Males tend to stay longer than females.
Number of Stays by Gender:
- Most renters have a single stay; fewer have multiple stays.
Marital Status:
- 57.7% did not disclose marital status; 98.5% of those who did are single.
Age Distribution:
- Majority of renters are aged 20-22.
Income Information:
- 70.2% disclosed income; higher incomes correlate with longer and slightly more repeat stays.
Renters Gender Distribution
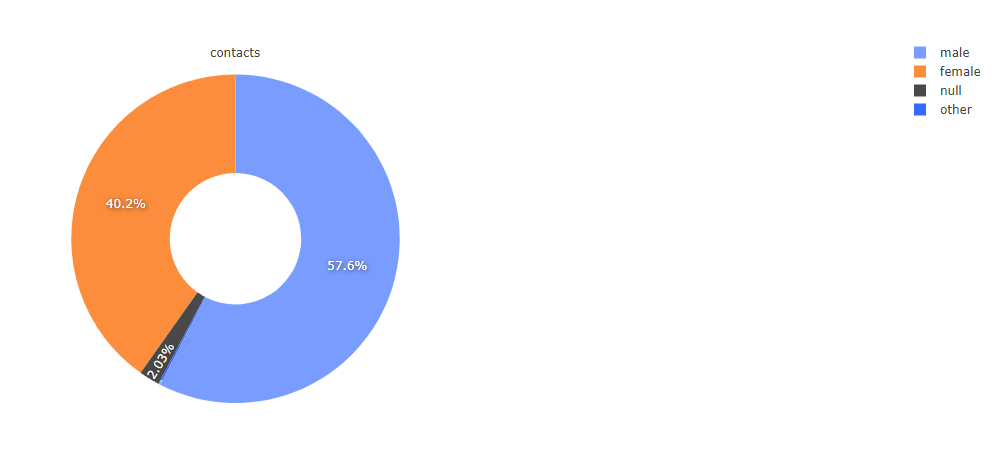
The data reveals that the majority of renters are male, comprising 58.4% of the contacts, while female renters make up 40.8%. Additionally, a small percentage identified as other or did not disclose their gender.
Insights:
- Majority Gender: Male renters are more prevalent.
- Inclusivity Needs: A small yet significant portion of renters identify as other genders or prefer not to disclose, highlighting the need for inclusive policies.
Stay Duration by Gender
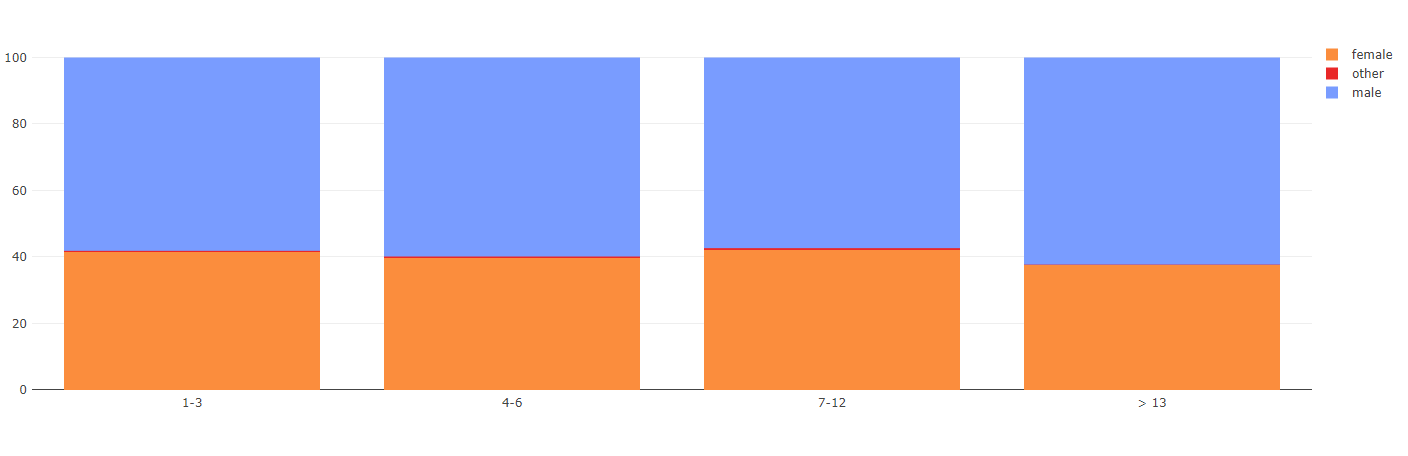
Analyzing stay duration by gender shows that males have a higher tendency to stay longer than females. Specific dates also indicate peaks in rental activity.
Insights:
- Long-Term Stays: Males are more likely to have longer stays.
Number of Stays by Gender
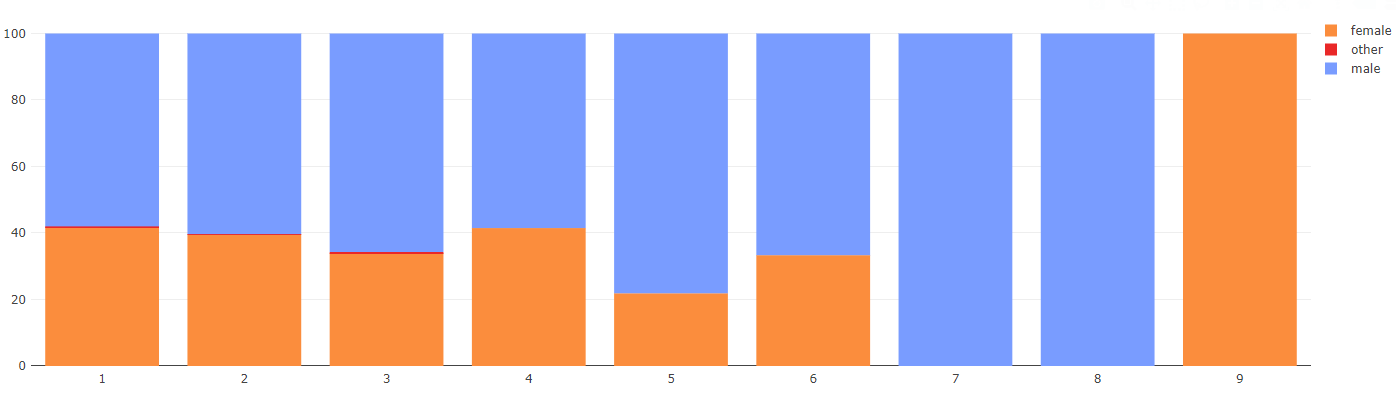
The majority of renters, regardless of gender, have a single stay. There is a significant drop in the number of contacts as the number of stays increases.
Insights:
- Single Stays Dominance: Most renters have only one rental period.
- Repeat Stay Potential: Understanding the factors influencing repeat stays can improve customer retention.
Marital Status
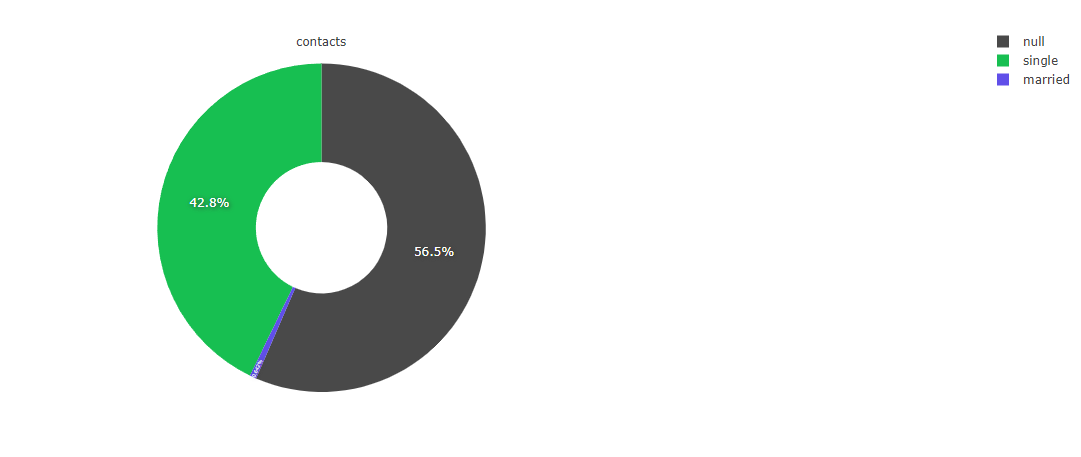
A significant portion of renters (57.7%) did not provide their marital status. Among those who did, single renters constitute the majority (98.5%).
Insights:
- Data Gaps: The lack of marital status information may affect the accuracy of insights.
- Single Demographic: Single individuals form the bulk of the disclosed demographic.
Age Distribution
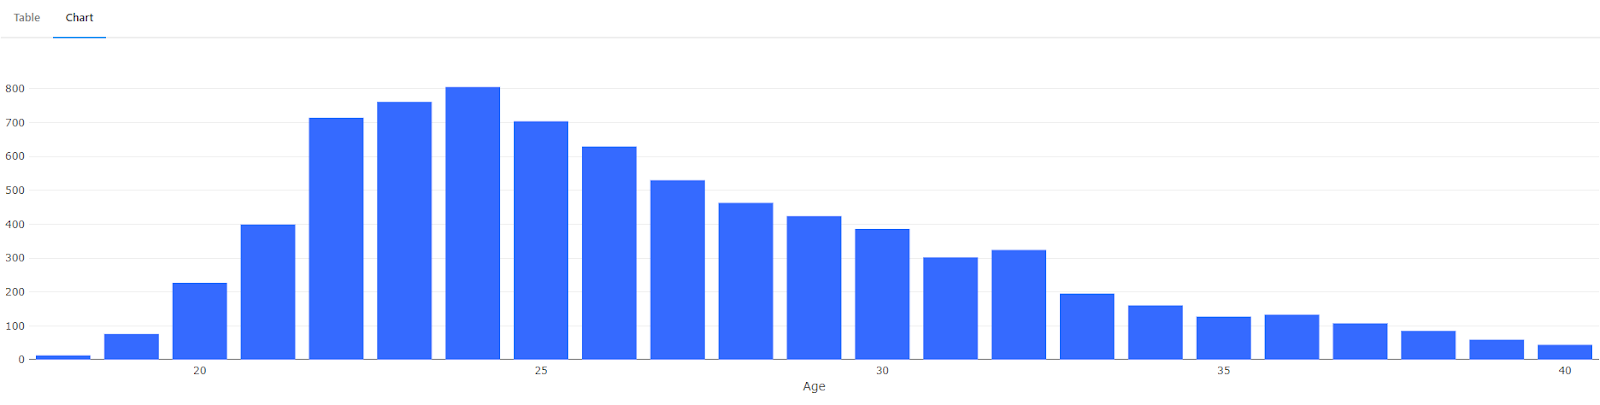
The age histogram shows a significant number of young renters, particularly between the ages of 20 to 22.
Insights:
- Young Renters: There is a higher number of renters in their early twenties.
- Potential Peak Ages: Ages 20 to 22 are common for renting.
Income Distribution Among Renters in 2024
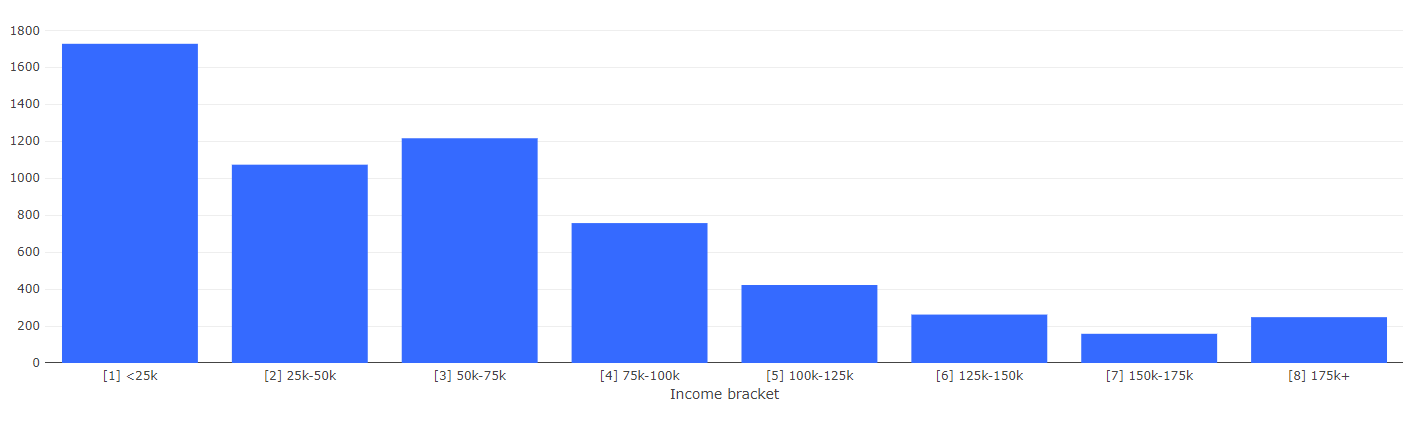
The analysis of renters’ income data for 2024 reveals a diverse range of income brackets among the contacts:
- Less than $25,000: 30.9%
- $25,000 – $50,000: 19.3%
- $50,000 – $75,000: 21.8%
- $75,000 – $100,000: 13.6%
- $100,000 – $125,000: 7.6%
- $125,000 – $150,000: 4.7%
- $150,000 – $175,000: 2.8%
- More than $175,000: 4.4%
Key Insights:
Low-Income Dominance: A substantial 30.9% of renters earn less than $25,000, highlighting the significant presence of low-income individuals within the renting demographic.
Mid-Range Presence: Renters in the income brackets of $25,000 to $75,000 collectively account for approximately 48.8% of the population. This indicates a strong representation of middle-income individuals among renters.
Decreasing High-Income Representation: As income levels rise, the representation of renters diminishes significantly, with those earning above $75,000 making up only 24.4% of the total rental population. This trend underscores a sharp decline in higher-income renters.
Economic Challenges: Renters earning less than $25,000 represent about 33% of the total, reflecting not only economic difficulties faced by these individuals but also a potential preference for renting instead of homeownership.
Limited High-Income Renters: Those earning above $150,000 constitute only 7% of the rental market, suggesting that high-income individuals are less inclined to rent compared to their lower-income counterparts.
This distribution indicates a significant presence of lower-income renters, with the largest group earning less than $25,000. There is also a substantial segment of renters with mid to high incomes, particularly those earning between $50,000 and $75,000. The number of renters decreases as income levels rise, but a notable portion of renters still falls into higher income brackets. This highlights the need for rental companies to offer a range of services and pricing options to cater to this economically diverse renter population.
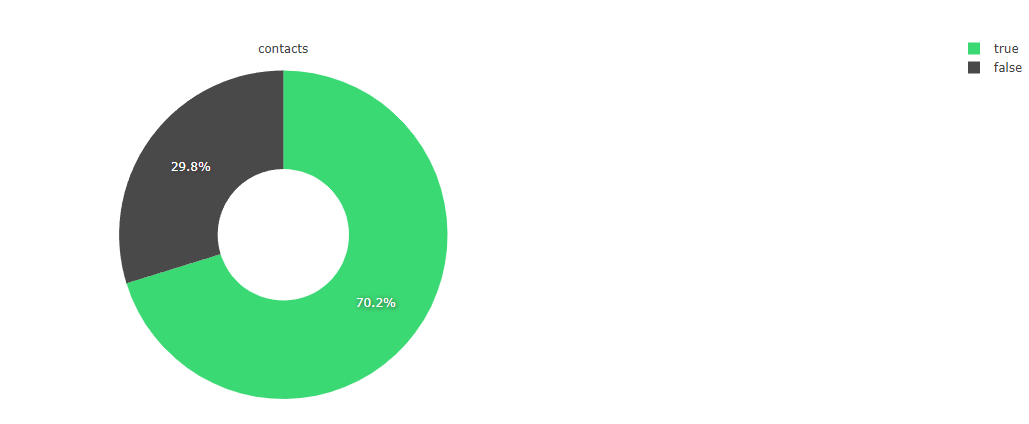
A majority of renters (70.2%) provided their income information, offering reliable data for income-related analyses.
Insights:
- Income Disclosure: The high rate of income disclosure suggests reliable income data.
- Income Influence: Renters with higher incomes are more likely to stay longer.
Income by Stay Duration and Number of Stays
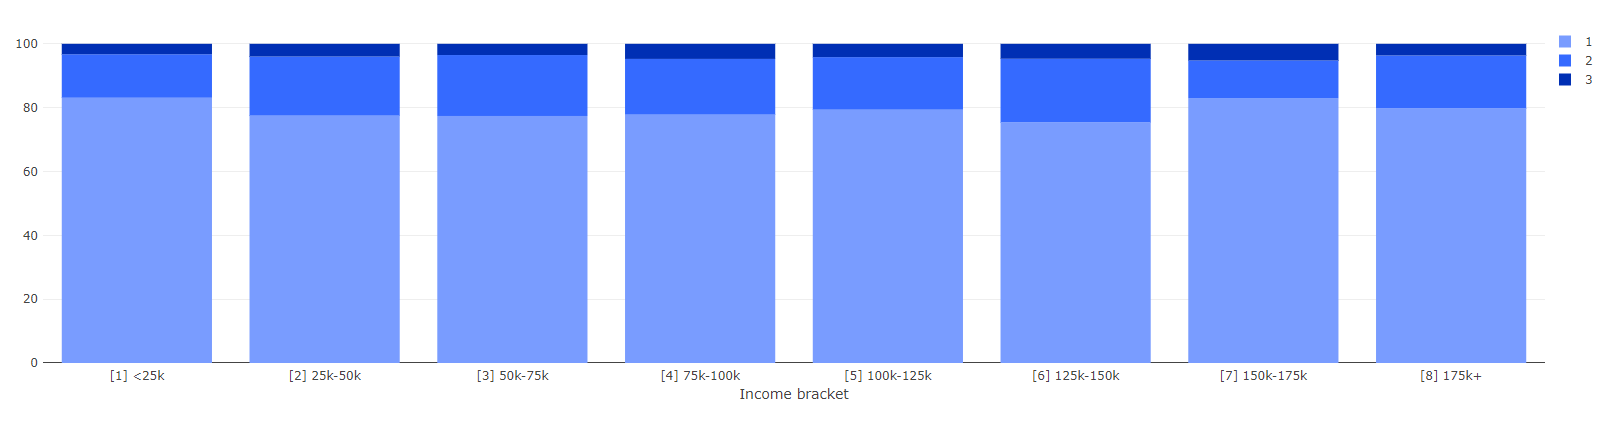
Higher-income renters tend to have longer stays and slightly more repeat stays compared to lower-income groups.
Insights:
- Longer Stays for Higher Income: Higher-income renters are more likely to stay longer.
- Repeat Stays for Higher Income: Higher-income groups show a slightly higher number of repeat stays.
Explore More About Rental Market
- 4 Unique Housing Trends That Complement Mid-Term Rentals
- Top 10 Best Real Estate Companies in The World
- Renters’ Reality: Half Live on Less Than $50K per Year
- New York City Hottest Neighborhoods Right Now
- Boston’s Cheapest and Most Expensive Neighborhoods to Rent in 2024
- NYC Most Expensive Neighborhoods to Rent in 2024: Rental Market Report