
Estimated reading time: 7 minutes
Throughout time, the cost of living has always risen due to inflation. The prices for basic needs (including rent prices) rise yearly, and we become accustomed to new prices no matter how high they get, forgetting how low they once were.
This is why it’s always interesting to look back in time and examine how the cost of different needs has changed. Throughout history, a place to live has always been one of the individual’s most essential and expensive needs. But back in the day, the cost of rent wasn’t always that expensive – at least by today’s standards. Let’s look at how the price of rent has changed in the U.S. from the 60s to present day.
Enjoy a hassle-free, high-end rental experience for stays of one month or longer in major US cities.

Fully-furnished rooms and apartments with flexible lease. Apply today and move in tomorrow.
The 60s
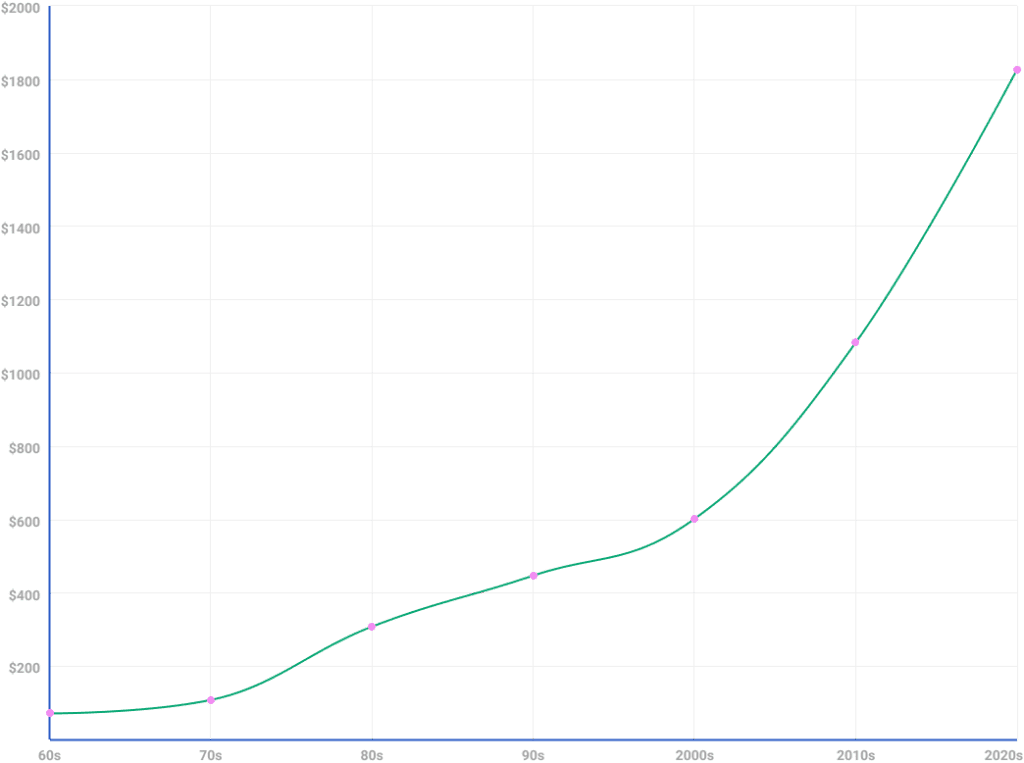
The American economy in the 60s is often described as having flourished. For renters, the average rent price was just $71. At this time, the cheapest state to rent a home was Alabama, at just $45 per month, and the most expensive state to rent a home was Alaska, for $126 per month.
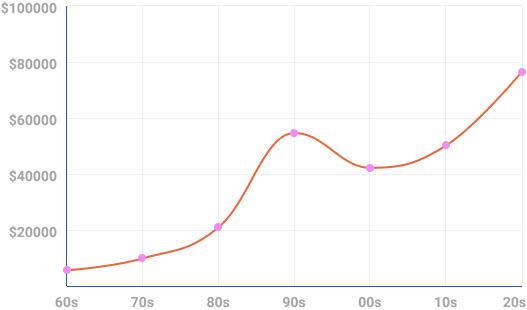
The median household income was $5,600 around then, so it was common for people to be homeowners without much strain. The average house cost in the 1960s would be $105,000 in today’s dollars.
The 70s
In the 70s, America was hit with widespread “stagflation.” This refers to a state of simultaneous high inflation and high unemployment, which creates a stagnant economy. As a result, the median monthly rent price was $108, which is a whopping 65% higher than the 60s, the previous decade.
Arkansas had the cheapest average rent cost at $71, while Alaska remained the most expensive, with the median rent ranging around $189. In 1970, the median household income was $9,870; by the decade’s end, it had risen to $16,530. By 1979, inflation had increased by 11%.
The 80s
In the early 80s, the American economy suffered a deep recession until 1982. By the end of the decade, monthly rent was up to $308 on average, and the median household income was $21,020, 7% higher than in 1979. Consumer prices also increased by 13% during the same period.
By 1989, the median income was $28,910. Rent in Alaska was $368 on average, the highest nationwide in the 80s. In contrast, Arkansas’s rent price increased slower than the national average at $185.
The 90s
Many people characterize America’s economy in the 90s by the rise of the internet, the services the internet created, and how this influenced employment.
During the 90s, the rent price was $447, and the median household income was $54,621 in today’s dollars. The economy began to recover from the recession, and interest rates lowered, so the housing market rebounded. Homeownership rates increased from 63% in 1990 to 67.4% in 1999. But this accelerated growth had consequences, and another recession followed at the start of the millennium.
The Early 2000s
As money inflows into housing projects, government policies promote home ownership, and lending conditions become loose, the 2000s’ infamous housing bust happens.
At the start of the decade, renters paid an average of $602 monthly. But by 2009, the lowest average rent for a 1-bedroom apartment was $486 in Alabama, $687 in Florida, and $833 in California. Hawaii and the District of Columbia had the highest rent rates, at $1,118 and $1,311, respectively. The average household income in 2001 declined to $42,228 due to the recent recession, but it did rise to $50,221 in 2009.
The 10s
Between 2010 and 2020, the American economy recorded the most prolonged economic recovery. The national average rent price increased 36% during this decade, fueled by a cooking job market and an increase in valuable land. Demand skyrocketed, raising prices.
During this time, the median household income also grew by 27%. In 2010, the average monthly rent cost was $1,083 compared to $1,473 in 2020. Similarly, the median house cost price for buying a house rose by an average of 31%, from $179,900 to $234,983.
The 20s
The current decade is not what anyone expected. COVID-19’s effects increased the price of almost everything from rent to commodities. Sadly, incomes are not rising at the same rate.
This January’s average rent price was $1,463, a 3% increase from the previous year. In April 2022, the national median rent was $1,827, a 16.7% increase from 2021, and the median household income in April 2022 was $76,563.
Want to know how much your rent has increased due to inflation?
For example, if your rent was $900 in 2018, how much has it increased due to inflation? Try this online rent inflation calculator and find out.
Check here, how rent has changed in 1,500 counties across the United States since the start of the pandemic.
U.S. Rent Prices have seen exponential changes
The American economy has been nothing short of a rollercoaster since the 60s. Thinking that the average rent cost has risen from $71 in the 60s to $1,827 in the present day is baffling, but then again, a lot can change in six decades.
June Homes knows that due to the average cost of monthly rent today, renters are always looking for a bargain. Our mission is to make renting as easy and straightforward as possible – which also applies to pricing. FInd a rental for a price that works for you by searching for homes according to your budget and enjoy solutions for cutting costs, like renting with roommates.
When you’re ready to find a rental customized to your needs and your budget, we’re prepared to help you find it.